
1. Ensemble
spectroscopy of native and reconstituted PCP.
2. Single molecule
spectroscopy of native PCP.
3. Single molecule
spectroscopy of PCP reconstituted with Chl a.
4. Single molecule
spectroscopy of PCP reconstituted with Chl a nd Chl b.
In Figure 1 we show absorption and fluorescence measured for three variuos reconstituted PCP complexes: red - PCP reconstituted with chlorophyll a (identical to the one present in the native form), blue - PCP reconstituted with chlorophyll b, and red-blue - PCP reconstituted with the mixture of chlorophyll a and chlorophyll b. The absorption of the PCP reconstituted with chlorophyll a is almost identical to the one measured for the native PCP. The spectrum features a broad and intense band (from 350 nm to 550 nm) associated predominantly with the absorption of peridinins. The main contribution from chlorophylls, besides the QY band - seen around 670 nm - is through Soret band at 437 nm. On the other hand, in the case of PCP reconstituted with chlorophyll b, the absorption spectrum is dominated by the Soret band, while the peridinin contribution is somewhat reduced.
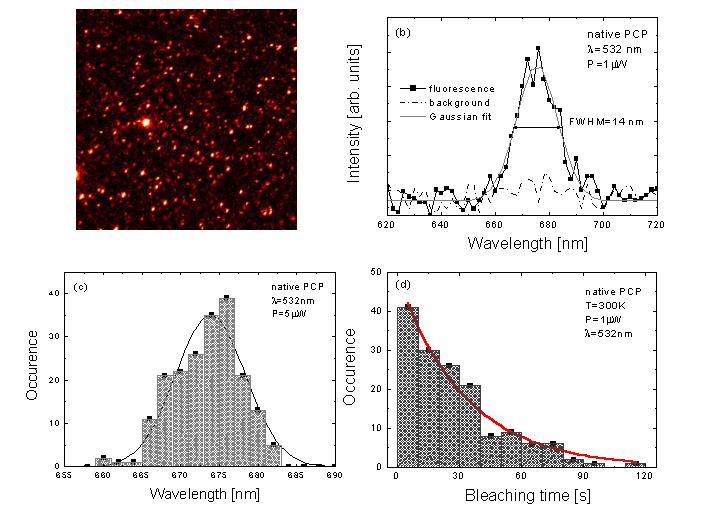
Figure 2 shows a summary of single
molecule spectroscopy results obtained for single native PCP complexes.
The image displays 30x30 micron area with a large number of fluorescing
PCP complexes (bright spots). The fluorescence is relatively stable and
features limited blinking during the scan. A typical spectrum of the native
PCP fluorescence is given in Figure 2b. The linewidth, estimated using
a Gaussian fit, is equal to 14nm, which is considerably smaller than for
the most of the biomolecules, including other light harvesting complexes.
Further, in Figure 2c we compare the distribution of emission energies
with the fluorescence spectrum of the PCP ensemble. Although the central
wavelength of the fluorescence exhibits some variation from complex to
complex, the overall distribution reasonably well mirrors the spectrum
measured at ambient temperature for the PCP ensemble, both in terms of
the central energy and the linewidth. This correlation indicates that the
photo-physical properties of single PCP complexes are not affected by the
surface and/or preparation procedure in any significant way.
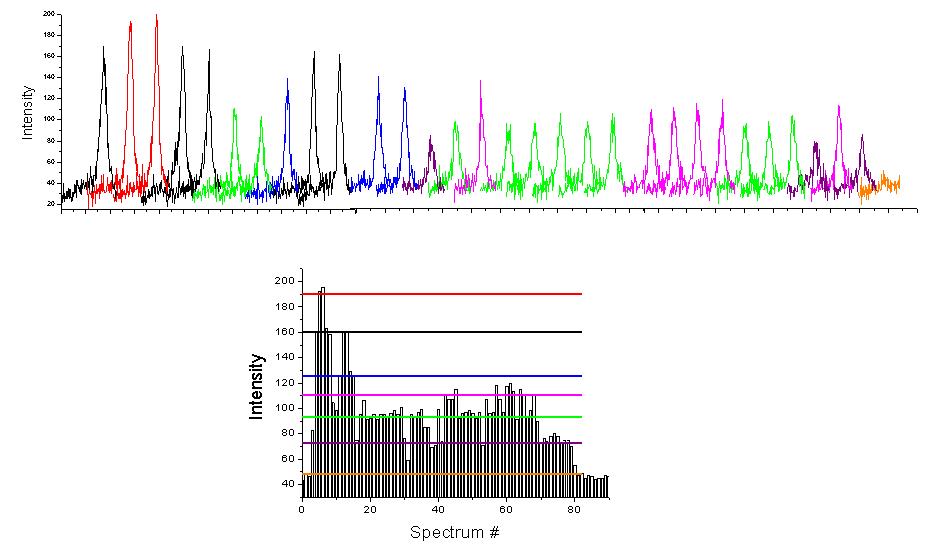
An example of the intensity trace
measured for a single PCP complex is shown in Figure 3. In this case we
observe several steps of the total fluorescence intensity of the complex
(color-coded), which we attribute to subsequent bleaching of the chlorophylls
within the complex. Indeed, as shown on the lower panel, we could identify
six steps in the intensity, which correspond to the number of chlorophyll
a molecules in the native PCP. Most of the complexes studied features between
4 and 6 steps. We also observe some complexes where only up to two steps
could be identified. We attribute them to monomeric PCP, which is suggested
to coexist with the trimeric form.
The most important conclusion drawn from this data is that the chlorophylls within PCP are very weakly coupled to each other. This property further distinguishes this complex from all the other light-harvesting systems, where the chlorophylls are strongly coupled and form an exciton. This conclusion is reinforced by the results of single molecule spectroscopy obtained for reconstituted complexes.
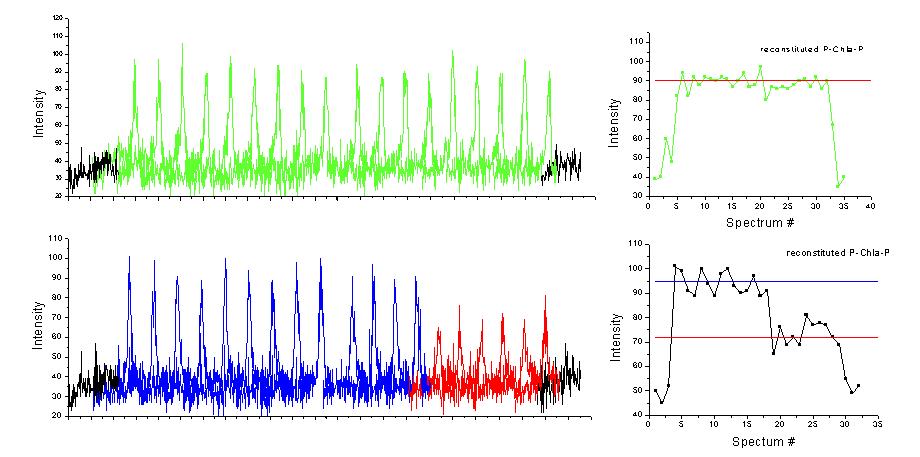
Qualitatively, the fluorescence spectra measured for PCP reconstituted with chlorophyll a are identical to the ones of native complex, the emission lines are very narrow and the fluorescence is quite intense and stable in time. However, as can be seen in Figure 4, the fluorescence of these complexes features less number of steps in the intensity. Namely, we observe either one single step or, as in most cases, two steps in the fluorescence intensity. This indicates, that the reconstituted PCP is monomeric, which makes it very attractive for various single molecule studies. Moreover, such a behavior provides a clear proof for weak coupling between the chlorophylls. The resulting ability to independently trace each and every chlorophyll in the complex allows us to gain important information about energy scheme of PCP complex.
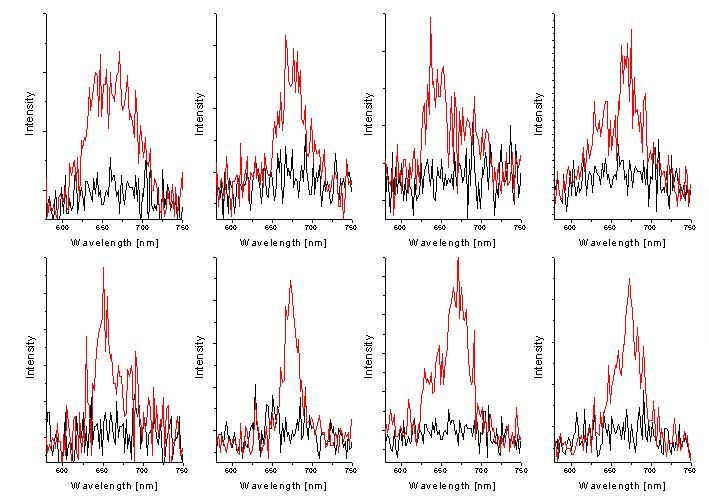
An example is given in Figure 5, which shows spectra of PCP reconstituted with Chl a before and after subsequent bleaching of the chlorophylls. For the complex displayed in the upper row, the energy difference between the two chlorophylls within the same monomer is very large, around 9 nm. In contrast, for the complex shown in the lower row, the splitting is negligible. This indicates that the two chlorophylls within a single monomer, which - from the structural point of view - should feel the same environment, are energetically distinguishable.
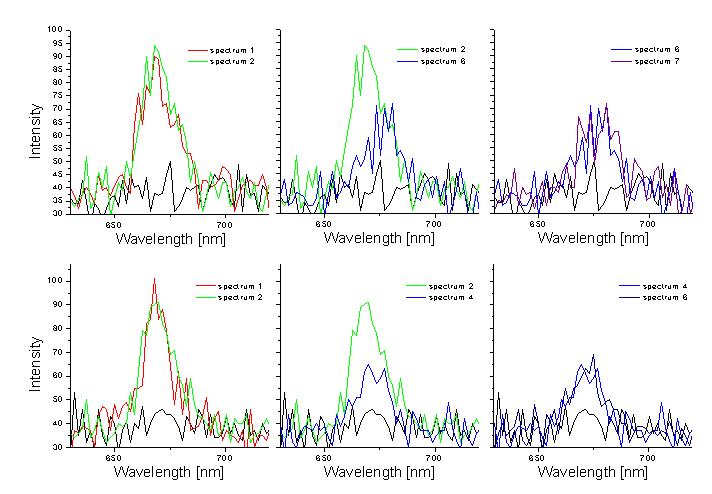
Particularly interesting are the complexes reconstituted with chlorophyll mixtures. In Figure 5 we show some of the spectra taken for PCP complexes reconstituted with both chlorophyll a and chlorophyll b. Clearly, we observe various situations. Sometimes, the fluorescence features single line, corresponding to one of the chlorophylls, but most of the times we observe two emission lines, whose energy splitting reaches up to 20 nm. We attribute them to the complexes containing two different chlorophylls.
MORE STILL TO COME :-)